Already available! The weekly World Economic Digest (Wednesday) on 13.08.2023 presents the most significant economic events and their impact on the world economy. In this issue, we will look at the latest updates in world trade, the development of financial markets, changes in the political situation and their possible impact on international firms and investors.
Eurozone
INVESTOR CONFIDENCE INDEX IN EU SENTIX: SOME IMPROVEMENT FROM THE LOCAL BOTTOM
The monthly Eurozone Sentix Investor Confidence index is calculated based on a survey of about 2,800 investors and analysts regarding their expectations regarding stock indices, bond markets, foreign exchange and commodities, as well as additional questions for the next 6 months.
August indicators: -18.4% yy vs -22.5% kg -17.0 kg in July-June (waited -23.4).
GERMANY: PRICE PRESSURE STILL PERSISTS
DESTATIS figures on consumer price growth of Europe’s leading economy in July showed the following figures:
July inflation was 6.2% yy (forecast 6.2% kg) vs 6.4% yy a month earlier. Monthly dynamics: 0.3% mm. vs 0.3% mm (forecast 0.3% mm).
Harmonized HICP index: 6.5% kg vs 6.8% g (expectations: 6.5% kg), and 0.5% mm vs 0.4% mm (waiting for 0.5% mm)
ECB SPEAKERS ARE INCREASINGLY BEGINNING TO ALLOW A PAUSE AT THE SEPTEMBER MEETING
The European regulator reduced its balance sheet by -€24 billion to €7.165 trillion, against an increase of €4 a week earlier. From the peak values (€8.836 trillion), the balance decreased by €1.671 trillion.
The rhetoric of ECB representatives:
Casimir:
• we are not far from the end of the rate hike process, but it is not over yet
• if there is a pause in September, it will not mean the end of the cycle
Panatta:
• the September decision has not yet been clearly formed
Centeno:
• the data indicate that the peak of inflation has already been passed, but it is at unacceptably high levels
THE TURKISH CENTRAL BANK HAS NOT SPENT RESERVES FOR TWO MONTHS TO SUPPORT THE LIRA, WHICH IS IN SORROW
The Turkish lira continues to update the next lows against the dollar, and now it is trading above 27 USD TRY, and it has lost more than a quarter of its value since the beginning of this year.
The regulator, under the leadership of the new head, twice raised the cost of borrowing from 8.5% to 15%, and then to 17.5%, but at the same time, inflation is growing strongly again: 9.49% mm / 47.83% yy in July vs 3.92% mm / 38.21% yy earlier, and these steps are certainly not enough.
However, back in June, the government decided not to spend reserves to maintain the national currency, and the situation in this segment began to improve somewhat.
UK ECONOMY REVIVES IN 2Q23, AND BOTH INDICATORS ARE BETTER THAN EXPECTED
According to preliminary data from the Office of National Statistics, UK GDP in 2Q2023 was 0.2% QoQ vs 0.1% QoQ in 1Q23 (forecast: 0.0% QoQ).
Annual rates increased to 0.4% kg vs 0.2% y quarter earlier (forecast: 0.2% y). Both indicators came out above preliminary estimates.
In terms of output, the services sector grew by 0.1% QoQ due to increased activities in the field of information and communications, tourism and catering, as well as growth in health and social services; the manufacturing sector grew by 0.7% QoQ, while the growth in processing was 1.6% QoQ.
In terms of spending, there was a strong increase in household consumption and government spending, which was partially offset by a drop in international trade flows in the second quarter.
China
CHINA'S FOREIGN TRADE IN JULY: THE FALL IS INTENSIFYING
China’s foreign trade statistics published today for July showed a further deterioration in indicators:
• * Exports: $281.7 billion (-14.5% kg) vs $285.3 billion (-12.4% yy) in June. Forecast: -12.5% yy
• * Imports: $201.16 billion (-12.4% kg) vs $214.69 billion (-6.8% yy). Forecast: -5.0% yy
• Trade surplus: $80.60 billion vs $70.62 in June
The figures again came out below the forecast. The slowdown in exports is, first of all, an indicator of weakness in global demand, which signals a slowdown in the global economy.
The weakness of imports is an indicator of subdued domestic demand in China. The Celestial Empire is recovering at a decidedly slower pace than the market expected
China: DEFLATION IN BOTH CONSUMER AND PRODUCTION PRICES
According to the National Bureau of Statistics of China, by the end of July, the growth rate of retail prices amounted to -0.3% kg vs 0.0% yoy and 0.2% yoy in June-May (forecast: -0.4%). Monthly indicator: 0.2% mm vs -0.2% mm in June (forecast: -0.1%).
Production prices: -4.4% kg vs -5.4% kg and -4.6% y earlier (forecast: -4.1% y)
The National Bureau notes that one of the key factors contributing to the decrease in CPI was the collapse of pork prices (-26% yy). In general, consumer demand in China continues to be quite restrained due to quite noticeable changes in the behavior of the Chinese, who have now noticeably reduced their purchasing activity.
Chinese Deflation
While the trends remain here – consumer prices have gone into deflation -0.3% YoY, although this is largely due to a decrease in food prices (1.7% yoy) and energy due to the high base of last year. Prices for consumer goods decreased by 1.3% YoY, while prices for services increased by 1.2% YoY. Prices in the housing sector remained virtually unchanged over the year (0.1% YoY), prices were actively growing only in the travel sector (13.1%), fuel prices were sharply decreasing (-13.2%).
But still, core inflation excluding food and energy increased and amounted to 0.8% YoY, in June it was 0.4% yoy.
Producer prices fell by 4.4% YoY in July due to lower prices in the extractive industries. In part, low core consumer inflation is a consequence of a rather weak increase in producer prices for short–term goods (0.8% YoY) and a drop in prices for long-term goods (-1.5% yoy) in conditions of excess production capacity and weak domestic demand. The drop in company profits fully confirms this – overproduction as it is. Given that the excess savings of Chinese households continue to grow, weak demand is not an income problem. So demand will continue to be stimulated by both monetary and fiscal measures.
USA
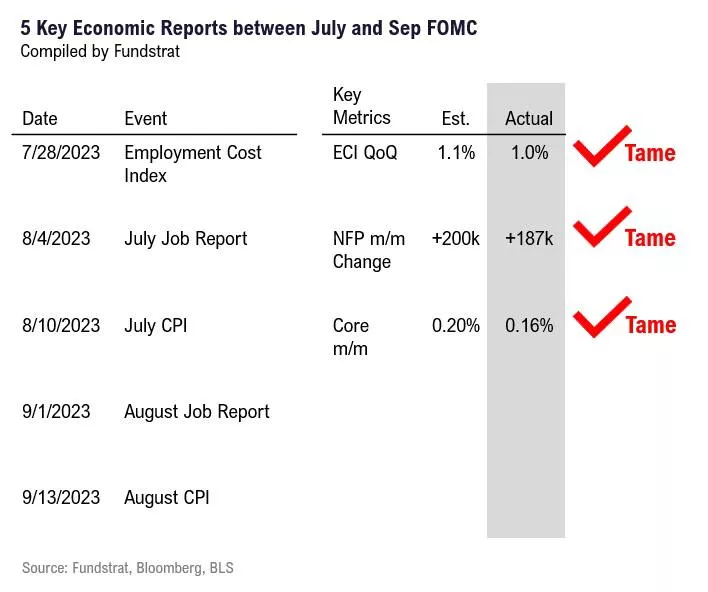
US INFLATION: THE BASE INDICATOR IS LOWER, AND THIS IS MORE IMPORTANT FOR THE FEDERAL RESERVE
US consumer prices increased in July with the elimination of seasonality by 0.17% mm sa vs 0.18% in June (expected: 0.2% mm sa). The annual figure rose to 3.18% kg vs 2.97% in June (expected: 3.3% yy).
Core inflation (with the elimination of the impact of energy and food prices): 0.16% mm sa vs 0.16% a month earlier (0.2% mm was expected). Annual rate: 4.65% kg vs 4.83% yy (forecast: 4.8% yy).
The annual CPI increased, but at the same time the Core CPI decreased, which is more fundamental for the Federal Reserve.
Compared to June, a smaller increase was recorded in new and used cars, medical services, and electricity. Monthly rates have increased in gasoline and fuel prices, food, transport services, and housing fees.
FED: THE RATE WILL REMAIN HIGH, AND THERE ARE CONCERNS ABOUT ECONOMIC GROWTH
The Federal Reserve’s balance sheet has grown by +$1 billion over the past week. vs -$36 billion. a week earlier. Now it is $8.258 trillion. From the highs ($9.015 trillion), the balance decreased by -$757 billion
The rhetoric of the Fed representatives:
Given:
• it is very early to talk about a rate cut, there is still a lot of work ahead
Harker:
• The bid will be restrictive for a while
Barkin:
• economic slowdown is a likely scenario
• the task of the regulator is not to cause a recession, but to stop inflation, and it is much higher than the goal
Bowman:
• it is possible that you will have to raise the rate even more
Williams:
• the “key” may decrease, but not in 2023
Temporary inflation will increasingly figure
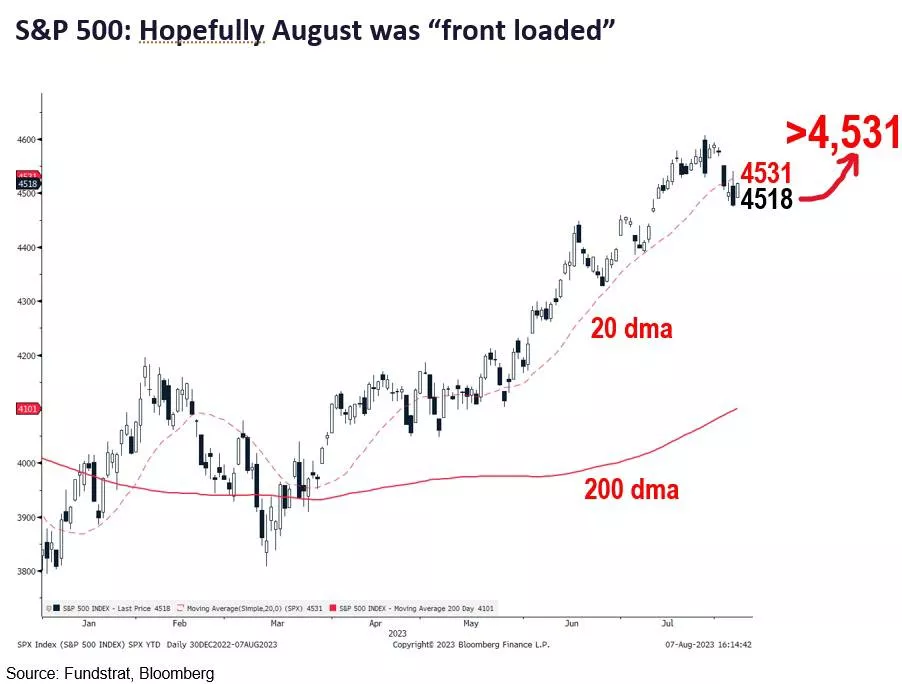
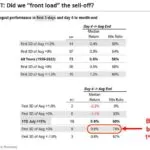
We are still in August, and this month we are nervously looking at the markets. But at the same time, this month’s sales are likely to be “frontal” in nature:
• * The key point is the return of the S&P 500 to the 20th dmo
• The 20th border is at 4,531, and the S&P 500 closed at 4,518, so the burden is on the market.
• Even if August is turbulent, we are still constructive towards the markets until the end of the year and we see that the S&P 500 will close >4,825 before the beginning of the year.
More and more Fed officials admit that inflation is cooling
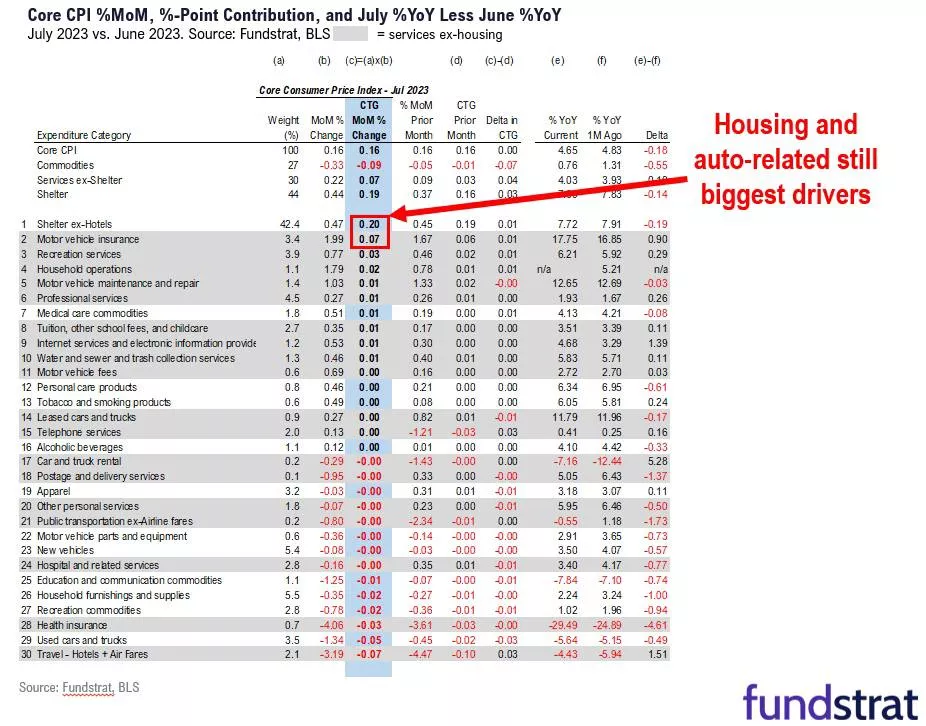
• The core CPI decreased to a rate corresponding to inflation of ~2%. +0.16% x 12 = 1.97%, which is <2%, and this is the second consecutive month of low core CPI.
• The base CPI excluding housing and cars, which amounted to +0.22% for the month. There is still a relationship between goods and services.
• Basic goods decreased by -0.33% for the month.
• Basic services excluding services for the month decreased by +0.22%, which corresponds to 2% inflation. The housing sector remains the main problem.
• Today, the probability of a November Fed rate hike has decreased to 18% compared to 22% yesterday and 31% last week. Thus, the probability of a rate increase has decreased. We still consider July to be the last rate hike in this cycle.
• The PPI index may be relevant because the focus is on new employment contracts and their impact on the PPI index. Deflation in China will still spread to the United States.
While stocks are selling, the July CPI report is encouraging and may be repeated
It follows that the stock sell-off is not directly related to the CPI report. Therefore, several questions arise:
• Has the bond market come to a different conclusion? We don’t think that’s the case, but if investors were prepared for lower rates, then a painful deal is higher rates.
• Maybe the markets are nervous about something else? Perhaps we know that the Bank of Japan has made changes to the regulation of the yield curve, and this may have lingering consequences. Or the markets are nervous because of Friday’s PPI or even weak data on China.
• But, in our opinion, inflation is moving on a lower and more favorable trajectory than many believe, and this will affect stocks more than today’s knee-jerk reaction.
USA: inflation has slowed down
Inflation in the US in July was expected to be 0.2% mom and 3.2% YoY, core inflation is also 0.2% mom, but 4.7% YoY.
The growth of food prices calmed down somewhat (0.2% mom and 4.9% yoy), energy prices increased by 0.1% mom in July, but here a significant drop in prices relative to last year by 12.5% by 0.9 percentage points reduces annual inflation (the effect of the base of last year will be sharply reduced from August and general inflation, annual inflation will rise).
Goods without energy and food continue to maintain deflationary dynamics of -0.3% mom and 0.8% YoY, but this is largely due to the ongoing correction in prices for used cars (-1.3% mom and -5.6% yoy).
Services provided the main contribution to price growth by adding 0.3% mom and 5.7% YoY – annual growth rates remained at June levels. Services excluding energy added 0.4% mom and 6.1% YoY – housing rental continues to play an important role here (0.4% mom and 7.8% yoy), prices continued to rise in transport services (0.3% mom and 9% yoy) and recreational services (0.8% mom and 6.2% yoy). But in medicine -0.4 m/ m and -1.5% yoy, but there is a distortion of the indicators due to the fact that the accounting of health insurance goes with a big lag and reflects the state subsidies last year, and it is reflected only this year.
Monthly inflation has been keeping within the Fed’s target for the past couple of months, but trend indicators and the services sector separately are still far from what the Fed would like to see.
The US budget deficit is still growing
In July, the US budget deficit was twice as high as market expectations and amounted to $221 billion, it was higher in July only in 2021, when the deficit was $300 billion.
In total, over the past 12 months, budget expenditures amounted to $6.72 trillion, which is 16.4% higher than last year, while revenues amounted to only $4.48 trillion and were 7.3% lower than last year. As a result, the budget deficit over the past 12 months amounted to $2.26 trillion, or about 8.6% of GDP. Even if we discard the $0.4 trillion advanced in September for writing off student loans, the deficit is still extremely high.
Of course, with such a deficit, the fiscal stimulus for the economy is extremely strong and overrides any monetary tightening, but this story will end. The United States will have to normalize the budget, both because of the growth of interest expenses on debt servicing ($0.87 trillion over the past 12 months), and because of the weak dynamics of income, which degraded due to the huge volume of various tax deductions Biden and Co. Which already leads to lower ratings.
Non-interest expenses will have to be cut at some point (or taxes will be raised, which Republicans are unlikely to do), which in conditions of high rates will be quite painful for the economy.
The average US government debt service rate continues to grow by ~25 bps per quarter (in money ~ $80 billion) and in July amounted to 2.84% per annum (in June it was 2.76% per annum). Not so much yet, but growth will continue here, and given the size of the debt (already $32.6 trillion), payments will become increasingly burdensome for the US Treasury.
Homeowners in the US are now spending a record 40% of their gross income on mortgages.
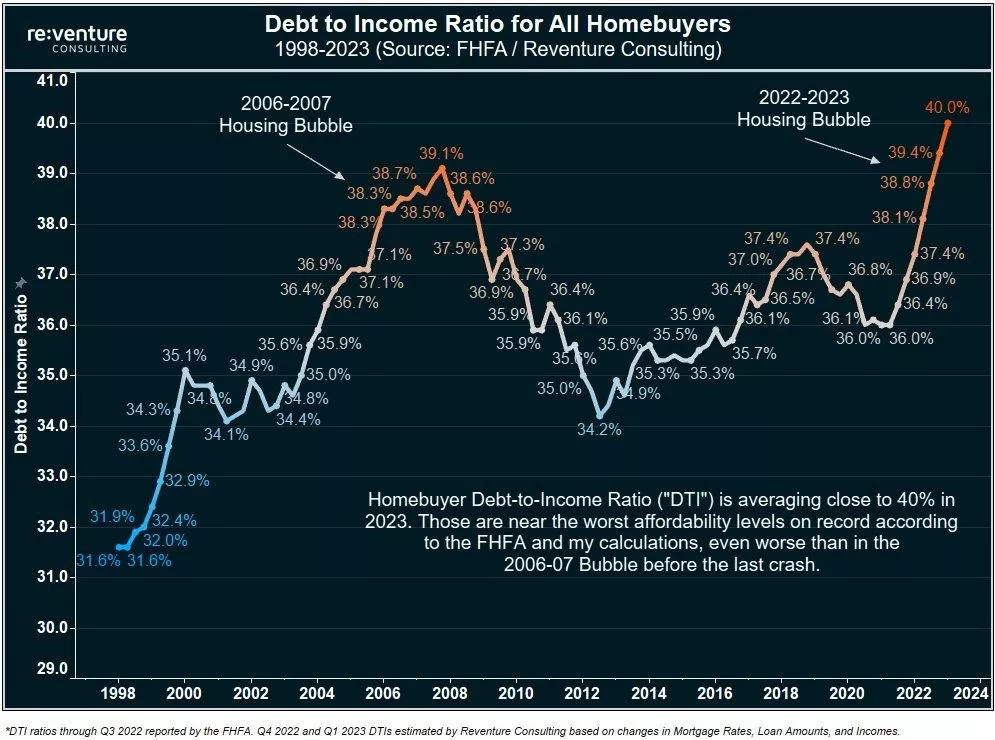
👉 This is HIGHER THAN the 2008 maximum of 39% and the value has increased dramatically over the past 2 years.
After paying income tax and mortgage expenses, most home buyers have less than 30% of their income.
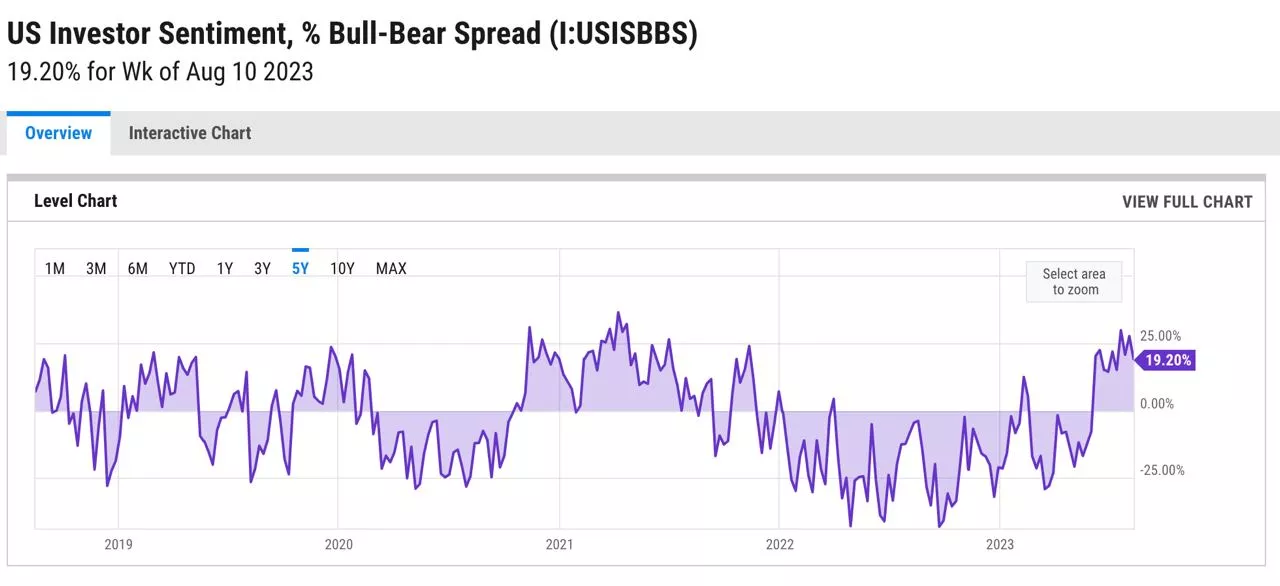
The spread between bulls and bears in the US is 19.20% compared to 27.66% last week and -8.33% last year. This is above the long-term average of 6.47%
Oil
THE DEFICIT IN THE WORLD OIL MARKET HAS INCREASED MARKEDLY
The OPEC monthly review published today maintained estimates of global demand in 2023 at 102.0 million bps (+2.44 million bps) vs 102.0 million bps. in June. In 2024, the demand will be 104.25 million bs (+2.25 million bs), the figures are unchanged. The main growth in consumption is China, South-East Asia, Latin America
The forecast of demand for OPEC oil in the third quarter is 29.57 million bs. At the same time, in July OPEC produced only 27.31 million bs, so the deficit in the market rose sharply to -2.26 million bs vs -120 thousand bs in June.
Saudi Arabia practically fulfilled its promise in July, voluntarily reducing production by 968 thousand bps at the declared 1 million bps. Production in Russia amounted to 9.5 million bs (-100 thousand bs by June)
IEA (IEA) REPORT, HIGHLIGHTS:
• Global oil demand will grow by 2.2 million bs in 2023 and reach 102.2 million bs, which will be a new record. The estimate is left unchanged compared to July
• Global oil production is expected to grow by 1.5 million bps to a record 101.5 million bps in 2023, while production growth outside OPEC+ (mainly in the United States) will amount to 1.9 million bps. Next year, non-OPEC+ supplies will also dominate the growth of global supply, increasing by 1.3 million bs, while OPEC+ may add only 160 thousand bs.
• OPEC+ in July lagged behind the oil production plan by 3.67 million bs (by 2.55 million bs – in June)
• RUSSIA: oil exports in June decreased by 200 thousand bs (in June by 600K bs) to 7.1 million bs.
• RUSSIA: China and India accounted for about 80% of all oil from the Russian Federation
• RUSSIA: estimated export revenue in July is the largest since November 2022: $15.3 billion (+ $2.5 billion per month). Since August, Russian exports will be reduced by another 500 thousand bs. According to OPEC estimates, Russia produced 9.5 million bs in July
@ESG_Stock_Market