Inflation Rate in US now Hits 6% YoY in February despite Used Car Drop

Inflation Rate in US now

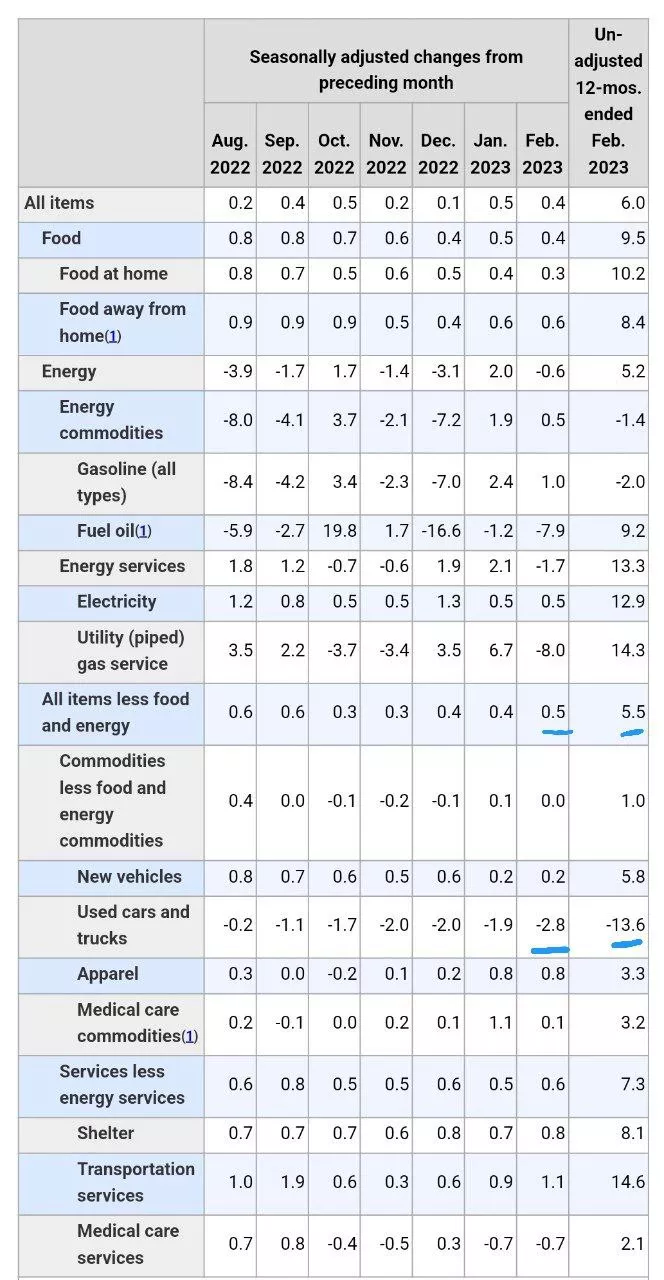
❗️US inflation in February was 0.4% mom, 6.0% YoY, core inflation 0.5% mom, 5.5% YoY. And this despite the fact that used cars unexpectedly gave out a drop again – 2.8% m/m…

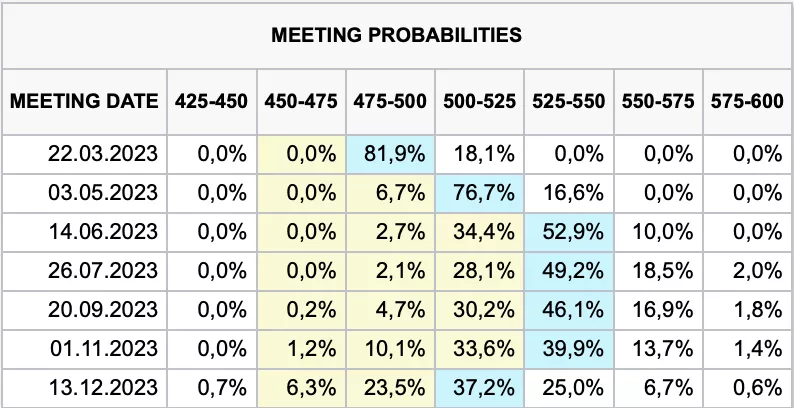
The banks’ opinions on the Fed’s further actions are divided, some believe that the Fed will cut rates in March… someone that leave unchanged… someone who will raise (1-3 times by 25 bps). The market has calmed down a little and is waiting for a 25 bps rate increase (69% probability) rather than remaining unchanged (31%), and another increase in May … but since July, he has been betting on a reduction in rates. The Fed needs to save face…

According to the current decisions on SVB and Signature, $264 billion of deposits need to be returned, of which about $30 billion and about $234 billion should be given by the Fed as collateral for assets (there are not enough securities on the balance sheets of both banks for collateral). The FDIC itself had $128 billion at the end of 2022, mainly in government bonds (for $126 billion of government bonds at face value). In 2021 and 2022, they managed to consolidate ~ $5 billion a year into the insurance fund. One way or another, the Fed will simply “print” about a quarter of a trillion dollars, which the FDIC will receive at 5% + per annum and distribute to depositors. The $25 billion that the US Treasury will provide is an amount close to the difference between the nominal and market value of collateral assets (a guarantee for the Fed).

At the weekend, J. Yellen refused to comment on the Fed’s further actions, saying on duty about the Fed’s independence and that they would evaluate it in the coming days and weeks. At the same time, she actually admitted that bankruptcies are a consequence of high rates: “The problems of this bank, from reporting about its situation, suggest that because we’re in a higher interest rate environment…”. There is no doubt that Yellen and Powell discussed this issue, but most likely no decisions have been made yet.
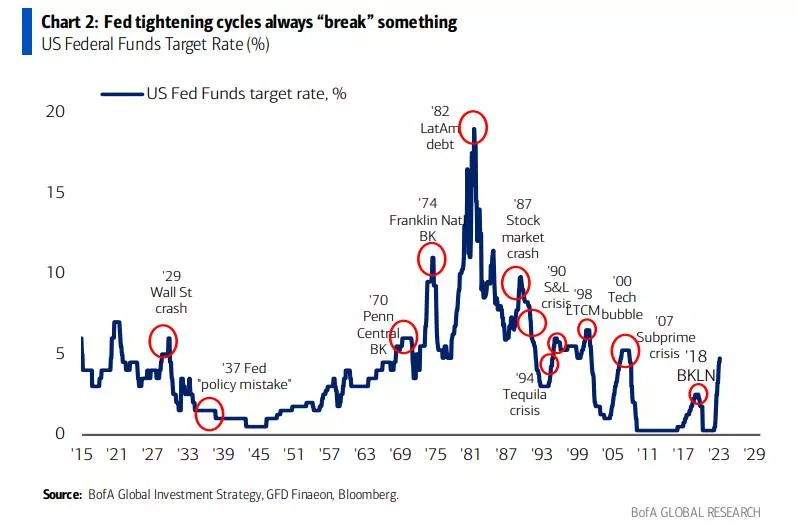
It is already obvious to everyone that what is happening is a consequence of the increase in rates, it is not obvious to everyone… but these are only the first signs of the consequences of the rate hike cycle, the losses of the financial system from the rate increase will continue to accumulate. For Powell, the situation is extremely unpleasant, a couple of days ago he went “hawk” (and not only he, but also other representatives of the Fed)… whether something has changed with inflation – not significantly. And just like that, to turn around right away is an epic failure and a blow to trust (which is so not very high). The market is already showing what it thinks – the growth of gold / bitcoin, the fall of the dollar, etc.

If inflation had slowed down on Tuesday, it would have been easier for the Fed to justify a reverse move. But no …


​​#USA #inflation #economy #Fed #debt #rates #dollar

Looking more closely at American inflation…

Externally, the report has no large deviations from expectations, total inflation is 0.4% mom and 6.0% YoY, without energy and food 0.5% mom and 5.5% yoy. But in reality, only one–time stories saved from a sharper price increase: used cars (-2.8% mom disinflation after a rapid takeoff), gas (-8% mom – heat), eggs (-6.7% mom disinflation) and medical insurance (-4.1% mom to the current inflationary reality has a very distant relationship). Together, these factors reduced monthly inflation by ~0.2 percentage points – too much.

Grocery inflation slowed down slightly by 0.4% mom and 9.5% YoY, but remains aggressive. Goods without energy, food and used cars added 0.4% mom and 4.2% YoY, growth decently slowed down from highs amid the migration of consumption from goods to services, but in the last three months the price increase has stabilized around 4-5% YoY. The main drive remains in services (0.5% mom and 7.6% yoy), active growth in housing continues (0.8% mom and 8.1% yoy), although this is an inertial growth, transport has accelerated (1.1% mom and 14.6% yoy), but mainly due to air travel (6.4% m/m).

If we discard various one–time emissions, inflation accelerated in February rather, various inflation indices cleared of volatile components remained at the ceiling of 6-7% YoY and even accelerated at the moment. I would still estimate the steady inflationary momentum as 4.5-5%, the New York Federal Reserve estimates at 4.9%. This means that even a neutral rate is 5-5.5%… and a restrictive policy means the rate is even higher. However, the same New York Fed published data on inflation expectations – annual expectations decreased from 5% to 4.2% than the Fed may try to justify caution. But the inflationary history as a whole speaks for an increase further.

PS: If anyone remembers, a couple of years ago, the Fed approved a new strategy and switched to targeting the average inflation rate (the average for 5 years is already 3.5%, for example), so if you approach it quite formally, then in order to fulfill your goals, Powell should lower inflation below 2% and keep it for a long time

@ESG_Stock_Market


The Fed raged, but the US Treasury corrected everything

Fed's rate hike

The Fed raged, but the US Treasury corrected everything

After a week-long pause, the Fed reduced its portfolio of government bonds by $32.4 billion and mortgage securities by 1.2 billion at once, the “other” assets of the Fed decreased by another $15 billion (where accumulated interest/coupons are usually taken into account), in total, the assets of the Fed decreased by $50.6 billion at once. But the US Treasury came to the rescue, which in a week reduced its reserves of “cache” at the Fed by $56.1 billion, and it did all this on February 15 in the amount of $87.9 billion. Despite the fact that one of the most significant weekly reductions of the Fed’s balance sheet took place this week, the banks did not have less dollars. And, given that banks have reduced reverse repos by $56 billion, there is even more free dollar liquidity – the balances on the accounts at the Fed have increased by $73.9 billion to $3.1 trillion.

There were more dollars, which helped the stock market in the face of the Fed’s aggressive rhetoric, but it certainly did not help the government debt market. Although the Ministry of Finance practically did not increase market debt during the week, the US government debt curve went up by 40-70 points in a week, the inversion of the curve remains around 1%.

The US Treasury still has a large margin of safety: $440 billion of cash in the Fed, which it will gradually spend in anticipation of the ceiling, adding dollars to the system and leveling the effect of the Fed’s QT and up to $400 billion of “emergency measures”. In April, the budget balance is usually positive (annual taxes), even with the growing costs of servicing the national debt, Yellen should have enough money until September.
After two consecutive months of buying US stocks by non-residents, “hot” loan money was attracted to the US market, in January, for the first time in six months, the volume of margin debt increased (positions with leverage) and immediately by $ 35 billion, to $ 641 billion. But they reached there through an increase in leverage, because the balance of funds on margin accounts did not grow, but even decreased from $164 billion to $161 billion. On the one hand, this is good for stocks at the moment, “hot” credit money has pulled up to record cashbacks and the influx of non-residents’ money, but this is in the moment.

If you look a little further, then against the background of the degradation of profits, the cashbacks may be lower (this is even if the Democrats cannot push through a tax increase). High rates will actively eat up free capital on margin accounts – margin is expensive, and for every dollar of cash now $4 borrowed is decent. The Fed is still aggressive:

✔️ hawks Mester and Bullard, although they have already increased by 50 bps again
, ✔️ the rest intend to keep the rate high, at least until the end of the year.

A reversal of the Fed, of course, is possible, but it is more likely to happen together with a financial shock (economic processes are much more inert than financial ones), which is unlikely to be positive for the market at the first stage of the action. In this regard, the arrival of “hot” credit money, although it supports stocks at the moment, but at the same time forms a mass for future descent when the market conditions worsen…. ​​#USA #inflation #economy #Fed #debt #rates #dollar

⚖️ Markets are putting the Fed’s rate hike in March on:

Fed's rate hike

0.25% with 82% probability
0.50% with 18% probability

a day ago:
0.25% with 85% probability
0.50% with 15% probability

a week ago:
0.25% with 91% probability
0.50% with 9% probability
https://www.cmegroup.com/trading/interest-rates/countdown-to-fomc.html

For the first time in the current US rate hike cycle, the market expects a rate higher than the Fed lays down

US rate hike cycle

📍 For the first time in the current US rate hike cycle, the market expects a rate higher than the Fed lays down (blue line).
Back in early February, market expectations for the end of the year were at 4.4%, on 16.02. – 5.08%, and on 17.02. – 5.13%.
📍 At the same time , the hawks )supporters of a tough policy) want to raise the rate by 0.5% in March, which is not yet being laid by the market. So, despite the sharp shift in market expectations on the subject of monetary policy, surprises are not over yet, and in general, they are now frequent guests.
#rate #usa #fed #finance #prep

The historical chart of the discount rate in the United States tells us that in the cycle of rate increases

chart of the discount rate in the United States

The historical chart of the discount rate in the United States tells us that in the cycle of rate increases, there is always some kind of “accident” in the financial system, which may be local (1987, 1998, etc.), or lead to a financial crisis (2008, 1929, etc.), but it always happens.
In addition, the current rate of rate hikes are second only to the 70-80 years of the last century – this definitely poses a danger that cannot be quantified.
#history #crisis #recession
Seasonal factors are a short-term risk factor. Thoughts for the next month.
Seasonal factors are a short-term risk factor, but the arguments in favor of stocks remain unchanged

Although there have been some “hot” inflationary economic data recently, it is too easy and tempting for supporters of inflation to pounce on them and think that inflation is skyrocketing.

But the Fed depends on the data, and does not “react to them,” and until the main factors of inflation grow rapidly – energy, housing and wages – the Fed will raise rates, but in a predictable way. This is what determines the lower volatility and this is what allows the multipliers to grow this year.

We assume that the shares will grow strongly in 2023, and the expansion of the spectrum contributes to this. For this, there were three factors that are observed only at major turning points in the markets, and this confirms our opinion that October 12, 2022 was the main minimum.

But we also have to respect seasonal factors, and we believe that 16.02-07.03 remains a period when markets may stall. As shown in the picture, the aggregate of 7 previous years, when the markets gained > 1.4% according to the “rule of the first 5 days”.

Performance of sectors, goods, currencies, companies as of 02/18/2023
Performance of US Equity Sectors (YTD):

1. Consumer Cyclical: +16.5%
2. Technology: +13.9%
3. Communications: +11.6%
4. Real Estate: +8.2%
5. Financial: +7.2%
6. Industrials: +6.7%
7. Materials: +6.2%
8. Consumer Defensive: +0.1%
9. Healthcare: -0.9%
10. Energy: -1.0%
11. Utilities: -2.2%

Performance of Metals in the USA (YTD):

1. Iron ore +12.2%
2. Copper +8.3%
3. Gold +1.4%
4. Zinc +1.3%
5. Aluminum +0.6%
6. Steel -3.4%
7. Nickel -9.1%
8. Silver -9.7%
9. Platinum -15.0%
10. Palladium -17.0%

Performance commodities in the USA (YTD):

1. Cocoa +6.9%
2. Lumber +0.2%
3. Soybeans +0.2%
4. Corn -0.1%
5. Sugar -1.1%
6. Wheat -2.1%
7. Oil -3.2%
8. Gas -49.4%

Top 5 Growth/Fall Leaders in the S&P 500 (YTD):

1. Tesla: +69.1%
2. Warner Bros. Discovery: +62.8%
3. Catalent: +58.6%
4. Align: +50.2%
5. Royal Caribbean Cruises: +47.7%

1. Lumen: -24.7%
2. Enphase: -22.6%
3. Baxter: -19.6%
4. APA: -18.4%
5. Pfizer: -15.7%

Top 5 leaders of growth/decline on NASDAQ* (YTD):

1. Coinbase: +84.2%
2. Tesla: +69.1%
3. Warner Bros. Discovery: +62.8%
4. Lucid Group: +60.0%
5. Airbnb: +53.9%

1. Enphase Energy: -22.6%
2. Sirius XM: -21.2%
3. APA: -18.4%
4. Chesapeake: -15.1%
5. ZoomInfo: -14.6%

* cap. > $10 billion

Top 10 largest US companies by capitalization (YTD):

1. Apple +17.4%
2. Microsoft +7.6%
3. Google +6.8%
4. Amazon +15.7%
5. Tesla +69.1%
6. Berkshire Hathaway -0.2%
7. NVIDIA +46.4%
8. Visa +7.6%
9. UnitedHealth -5.9%
10. Meta* +43.7%

Top 5 leaders of growth/decline of Chinese stocks* (YTD):

1. Baidu: +29.3%
2. Aluminum Corp of China: +23.4%
3. Li Auto: +22.7%
4. Netease: +22.0%
5. HSBC: +21.8%

1. JD Health: -17.2%
2. Meituan: -16.7%
3. Smoore: -15.9%
4. Kuaishou: -15.3%
5. Henhan: -8.3%

Top 10 largest companies in China by capitalization (YTD):

1. Tencent +17.8%
2. Kweichow Moutai +5.2%
3. Alibaba +16.0%
4. ICBC +2.0%
5. CCB +2.7%
6. China Mobile +11.6%
7. HSBC +21.8%
8. Contemporary Amper +7.2%
9. Agricultural Bank of China +3.8%
10. CM Bank +3.1%

Top 5 Growth/Fall Leaders on MOEX* (YTD):

1. Polymetal +27.5%
2. Globaltrans +25.7%
3. Sberbank +13.2%
4. Ozone +12.9%
5. Pole +12.7%

1. Tatneft -9.2%
2. Tatneft AP -6.6%
3. X5 Group -5.7%
4. Lukoil -5.6%
5. Rosneft -5.6%

People’s portfolio of shares of the Russian Federation on the Moscow Exchange (shares)*:

1. Sberbank JSC: 26.6%
2. Gazprom: 22.5%
3. Lukoil: 10.4%
4. Norilsk Nickel: 9.6%
5. Sberbank AP: 7.1%
6. Yandex: 5.4%
7. Rosneft: 5.3%
8. Surgutneftegaz AP: 5.1%
9. Novatek: 4.2%
10. MTS: 3.8%

Company Results (YTD):

1. Sberbank JSC +12.8%
2. Gazprom -5.8%
3. Lukoil -5.9%
4. Norilsk Nickel -5.7%
5. Sberbank AP +11.3%
6. Yandex +8.5%
7. Rosneft -6.2%
8. Surgutneftegaz AP +2.6%
9. Novatek -4.4%
10. MTS +5.5%

Portfolio result since the beginning of the year: +2.0%.

Currencies and Cryptocurrencies* (YTD):

1. USD** +0.2%
2. EUR -0.1%
3. GBP -0.4%
4. JPY -2.3%
5. CNH +0.8%
6. RUB -4.9%
7. KZT +3.3%

1. Bitcoin +49.2%
2. Ethereum +42.1%
3. Ripple +17.0%
4. Cardano +64.3%
5. Solana +134.8%
6. DogeCoin +25.5%

* against the US dollar
** DXY – dollar index

Performance of World Indices (YTD):

US:
S&P-500: +5.9%
NASDAQ: +12.0%

Asia:
Shanghai Comp.: +4.4%
Nikkei: +6.1%
Nifty 50*: -1.0%
KASE**: +4.0%
XU100***: -9.7%

Europe:
DAX: +10.6%
FTSE-100: +7.1%
CAC-40: +12.7%
MOEX: +0.5%

* indian index
** kazakhstan index
*** Turkish index

Source: https://finviz.com

@ESG_Stock_Market

Don`t copy text!