How was it in 2021/2022 when the national debt increased?

How was it in 2021/2022 when the national debt increased?

The last time the debt limit was raised on December 16, 2021, what happened:

The US Treasury took $0.64 trillion on the market in 6 weeks, of which $0.28 trillion (44%) were bonds, the rest were short–term bills, deposited $700 billion to the Federal Reserve account (in January the budget surplus).

The Fed’s reverse repos did not change much last time, remaining in the region of $1.6-1.65 trillion, everything went into reducing the cache of US banks of $ 450-500 billion.

The UST10Y yield rose from ~1.4% to 1.8% by the end of January and to 2% by mid-February, but then the Fed was entering a policy tightening cycle. In the first two weeks, the S&P 500 rewrote the highs above 4.8K, after which it confidently turned down;

The situation then was different from the current one: the Fed was still conducting QE and bought ~ $120 billion worth of securities in 6 weeks, now QT in similar volumes (the supply of government debt to the market will be greater). Back then, the market was already laying the beginning of a rate hike cycle, now the cycle is on the wane and the market is laying a decline. Then the banks had a large amount of free liquidity, now it is comparable to what Yellen would like to take to her accounts and she will have to fight for it, which implies pressure on government bonds (premiums for loans).

@ESG_Stock_Market

The recession has reached the labor market

The recession has reached the labor market

📉👷‍♂️The recession has reached the labor market. According to the US Department of Labor, unemployment in May rose to 3.7% (6.09 million). With a forecast of 3.5%. In April, it was 3.4%. In May, the indicator returned to the level of November 2022.

Unemployment in May is the most active growth in the youth segment of 16-19 years (10.3%). Among the main ethnic groups, African Americans have the highest unemployment rates (5.6%). The main trend in May is an increase in the rate of reduction of employees with higher education:
🏫College 3.2%
🎓Bachelor’s degree 2.1%
Previously, high rates were mainly among unskilled labor.

👩‍💼The main groups of unemployed are those laid off in December-February 2023 and May 2023.
Duration of job search:
▪less than 5 weeks +217K
▪️5-14 weeks -50
▪️15-26 weeks +179
▪️More than 27 weeks +3

@ESG_Stock_Market

USA: vacancies have grown again

USA: vacancies have grown again

​​#unemployment #inflation #economy #Crisis

USA: vacancies have grown again

The report on vacancies in the United States for April recorded an increase in open vacancies to 10.1 million, the data for March was also revised up. Although, in general, the situation on vacancies indicates a further decline, but it is not happening so quickly, and the market remains very overheated. There were 1.8 open vacancies per 1 unemployed person in April, i.e. the excess is still very large. All the growth occurred in the private sector (430 thousand), the public sector recorded a reduction in vacancies.

Surveys of small businesses confirm this situation – the majority of companies claim a significant amount of open vacancies. Compensation in the small business sector is also growing, but here the indicators have decreased. In general, there is no way to say that the labor market has come out of the overheating phase, weekly applications for unemployment benefits are still at a fairly low level below 250 thousand. The total number of benefits is 1.8 million, which also does not yet indicate any significant changes in the labor market. There are a number of signals for a slowdown in wage growth, but the growth rates themselves remain much higher than the Fed would like to see.

In general, while the labor market does not allow the Fed to relax…

#unemployment #inflation #economy #Crisis @ESG_Stock_Market

The US economy is experiencing a phenomenon similar to what preceded the recession of 2007-2008.

US economy

#recession #economy #gdp #gfc #vvd

The US economy is experiencing a phenomenon similar to what preceded the recession of 2007-2008.
📍We usually estimate the state of the economy by GDP, which continues to grow in real terms (taking into account inflation) – this is shown by the brown line on the charts. However, if we pay attention to gross domestic income in real terms, that is, the sum of all incomes in the economy adjusted for inflation, then this indicator has been falling for the second quarter in a row (marked on the upper graph). The main reason for this is a decrease in corporate income.
In the United States, the process characteristic of the beginning of the recession begins – a reduction in income. Similar dynamics of indicators were observed before the Great Financial Crisis (shown in the lower graph), and who knows, perhaps the coming crisis will become even more majestic. @ESG_Stock_Market

US economy
US economy
US economy
US economy

THE EUPHORIA IN THE MARKET ABOUT THE DEAL MAY BE SHORT-LIVED: THE EMPLOYMENT REPORT AND THE FED’S DECISION ARE ON THE WAY

THE EUPHORIA IN THE MARKET

THE EUPHORIA IN THE MARKET ABOUT THE DEAL MAY BE SHORT-LIVED: THE EMPLOYMENT REPORT AND THE FED’S DECISION ARE ON THE WAY
🇺🇸Although everything in Washington points to the conclusion of an agreement on raising the debt ceiling, Wall Street believes that the euphoria from such a deal has already passed or will be short-lived next week.

Similarly, as soon as the euphoria associated with Nvidia’s good forecast of $NVDA for the second quarter and enthusiasm for everything related to AI subsides, investors’ attention will switch to non-agricultural employment data for May, which will be released next Friday (according to Dow Jones estimates, 188,000 new workers are expected places) and the next Fed meeting on June 13-14.

To top it all off, June is usually a bad month for stocks anyway, regardless of what’s going on in Washington and speculation about the Fed’s decision.

“The reason why June is usually weak is that the reporting season is already coming to an end, which means that companies are relatively calm, which means investors depend mainly on political news,” said Jay Hatfield, CEO of Infrastructure Capital Management. “This year, the debt ceiling negotiations, the Fed’s hawkish comments and the banking crisis are looming on the market. It looks like there will be an agreement on the debt ceiling over the weekend, which should help the market stabilize.”

The problem for many on Wall Street is the dynamics of the S&P 500 Tech, which has grown by more than 5% this week; the Nasdaq Composite is ahead by 2.5%, and the S&P 500 is up by 0.3%, which may mask the non-obvious weakness of the market, which is growing only at the expense of certain assets. The S&P 500 indices of consumer goods, materials, healthcare and utilities declined 2.4%-3.2% this week, while the Dow Industrials index declined 1%.

“Although the S&P 500 is up 9.5% in 2023, only a few stocks are performing well. The number of stocks trading above their 200-day moving average has been falling since mid-April,” Liz Yang, head of investment strategy at SoFi, wrote on her blog on Thursday.

“The ‘summer rally’ in most years is the weakest rally of all four seasons,” Stock Trader’s Almanac says.

“Unfortunately, the market background “remains alarming and sets up for further sideways movement and a likely pullback or correction during the weak summer months, especially after mid-July in the worst two months of the year – August and September,” Jeffrey Hirsch, editor-in-chief of Stock Trader’s Almanac, wrote on Thursday. @ESG_Stock_Market

When Little Pent-Up Demand Is Left

When Little Pent-Up Demand Is Left

Morgan Stanley, Sarah Wolfe on behalf of (chief economist) Ellen Zentner:

When Little Pent-Up Demand Is Left

An extraordinary rise in spending on services, combined with a modest recovery in the consumption of goods, led to a decrease in the personal savings rate by a ten-year minimum. Now the recovery of real spending on services is almost complete, which means that the growth of spending on services should slow down, while spending on goods continues to return to its pre-Covid share of income and PCE. Since spending on services accounts for 65% of the share of consumer wallets, the slowdown in growth contributes to lower inflation in the service sector. We expect that a further return (to past levels) of goods consumption, combined with weak growth in the services sector, will allow the Fed to approach the 2% inflation target without causing a recession.

Let’s rewind 2.5 years ago. It’s January 2021, and households are gradually coming out of the hibernation caused by Covid, but the widespread spread of the vaccine is still a few months away. Consumers allocate 5% more funds from their wallet for goods than before Covid, which contributes to record consumption of consumer electronics, household and repair goods, sporting goods and recreational vehicles. Also 2.5 years ago, we made a highly competitive forecast that the spread of the vaccine in the spring of 2021 would lead to a sharp increase in costs for services and payback of goods.

This return has occurred, but paired with greater-than-expected demand, thanks to unprecedented fiscal stimulus, excess savings and a substantial supply shortfall. Thus, we observed not only a shift from goods to services, but also an increase in total spending. The result was a 13 percent increase in goods inflation for almost three years, an acceleration in services inflation and a return to pre-Covid spending habits, which are much larger in real rather than nominal terms. (Figure 1). The biggest gain from Covid was received by stay-at-home products….
..and we have seen the most sustained recovery in discretionary services, including catering, accommodation, public transport and recreational services.

The increase in interest rates led to a decrease in spending on durable goods, which contributed to a slowdown in core goods (2.1% YoY as of April 2023 compared to 9.7% yoy a year ago and we expect that further deflationary pressure will reduce it to -0.2% YoY by December 2023 and to -1.3% YoY by December 2024.). As the supply of labor increases and deferred demand decreases, the pressure on inflation in the service sector begins to weaken. Inflation of basic goods is projected to decline further, and core-core services (core services excluding housing and medical prices) inflation has begun to slow down and as of April 2023 increased by 6.6% YoY, down from a peak of 7.4% in February 2023. The greatest impact on core-core services should occur in the second half of 2023 (5.4% YoY by December 2023 and 4.2% YoY by December 2024).

The growing savings rate leads to a reduction in the overall “pie” of spending, and households have a reduced need and desire to spend on goods and services. This makes it easier for the Fed to achieve the 2% inflation target without causing a recession. There is a potential to reduce the consumption of goods due to reduced needs and rising prices, as well as opportunities to slow down the consumption of services without it becoming negative. Real consumption of services, which increased significantly in 2021 (6.3% YoY) and 2022 (4.5% YoY), is expected to return to pre-Covid levels in the future. @ESG_Stock_Market

Nomura Securities, Charlie McElligott – My opinion about NVDA

Nomura Securities, Charlie McElligott (in his note to clients by mail)

Nomura Securities, Charlie McElligott (in his note to clients by mail):

“My opinion about NVDA: when you see how the 4th largest stock in SPX and QQQ rallies at one point by +28% after-hours (vs an options implied move of ~7.5%) on the shock of profit growth, it’s just an absolutely brutal demonstration of strength, saying that that this generative AI boom is a “Real Thing”… when revenue exceeded $11.0 billion. compared to the previous forecast of $7.2 billion (+53% compared to the previous forecast – WUT?!) … when the excess of the forecast > the market capitalization of 93% of Russell 2000 shares … and while the EPS estimate for 2024 was $4.60 before the publication of profit, and now some analysts are throwing numbers, almost twice as high as these forecasts for the next year…and after the company added 1.5 Intels on cap’y per night…It’s just a fool’s mistake – trying to pick the top and short MegaCap Tech or the US stock index as a whole on the “valuation” thesis alone (this, in my opinion, will require a likely “inflation surprise/escalation of policy tightening” additionally), as these companies prove again and again the old thesis of “secular growth”, which made these stocks incredibly popular at this stage: they don’t need a hot economic cycle to surpass revenues and profits, as they are simply liquid, money-generating machines.” @ESG_Stock_Market

USA: bidding for the limit

USA bidding for the limit

USA: bidding for the limit. As the US Treasury is running out of money, and the April taxes do not yet give hopes for a large budget surplus, politicians are stirring. Republicans in the House of Representatives of Congress are ready to raise the debt limit by $1.5 trillion, or within this amount by the end of March 2024. But with the condition of budget cuts on topics sensitive to Democrats, which will almost certainly lead to Democrats “wrapping up” the draft in the Senate, even if Republicans can get it through the House. The Democrats themselves have already said that the ceiling should be raised without any conditions, but the political fuss has begun.

How much time Biden and Yellen have left… As of April 18, the cash on Treasury accounts was $252.6 billion, which is $75 billion more than it was at the end of March. The situation is worse than in 2022, when by April 20 it was possible to increase the cache by ~ $190 relative to March, i.e. while Yellen is rather closer to the lower limit of expectations of a $150-200 billion surplus in April. The US Treasury can get up to $300 billion more by borrowing as part of the implementation of emergency measures, i.e. in the amount of ~ $0.5-0.6 trillion should still remain at the end of April – this should be enough for May-July and maybe for part of August this year. Some people say that June is already “everything”, but for now it’s more like speculation, although we need to wait until the end of April.

The Republicans’ proposal pushes the ceiling issue right under the election, and the proposed debt growth limit of $1.5 trillion, of which most will go to interest on the debt, does not give Yellen the opportunity to restore the cache to skip the election. The Democrats, of course, cannot allow this, but at least the subject trade has begun. We are watching the continuation of the show with curiosity … @ESG_Stock_Market

P.S.: annual CDS on the US national debt are confidently at historical highs
​​#USA #inflation #Finance Ministry #debt #rates #dollar

Dollar LIQUIDITY what is happening now, everyone is already confused

Dollar LIQUIDITY what is happening now, everyone is already confused

Dollar liquidity measures the ability of the dollar to be used for transactions and activate other forms of financial assets. Currently, this presents a confusing situation for investors. Let’s take a closer look

LOANS

Curiously, at the end of March the volume of reverse REPOs for non-residents halved

LOANS

But foreign companies have increased loans, and quite aggressively

But foreign companies have increased loans, and quite aggressively

This could indicate a shortage of dollars outside the U.S. financial system.

FRS BALANCE

Fed’s balance sheet shrank by $17 billion in the week, a steady trend relative to last year The Fed's balance sheet shrank by $17 billion in the week

The blue line is the annual dynamics of the Fed balance sheet, the green and red are the mortgage bonds and treasuries on the Fed balance sheet. As we can see, all indicators are below zero, i.e. below last year.

DOLLAR LIQUIDITY

The Ministry of Finance account decreased by $54 billion, with about $80 billion remaining in the account of the Ministry of Finance, which is a historically low value – this is marked by the blue line on the chart

The red line is non-resident reverse repos, which rose by $12 billion during the week and returned to historic highs.

The red line is non-resident reverse repos, which rose by $12 billion during the week and returned to historic highs.

EXCESS RESERVES

EXCESS RESERVES

Excess reserves that are not generating income (blue) are down $34 billion and those that are generating income (red) are up $78 billion,


The growth of reverse repos continues to generate losses for the Fed, with $48 billion in losses already accumulated.

LIQUIDITY DYNAMICS

Liquidity in the system decreased by $40 billion (blue line) due to absorption from reverse repos, and also in a sideways trend after the start of the banking crisis

LIQUIDITY DYNAMICS

The U.S. stock market (the red one is the S&P500) has gotten off the ground, and the accumulated divergence is quite significant.

FINANCIAL CONDITIONS

According to the Federal Reserve Bank of Chicago, credit conditions have begun to tighten (blue line), but for some reason the dollar is not feeling it and continues to weaken (red line is the annual trend of the dollar) - suggesting that the dollar market is "long-covered" before rising.

According to the Federal Reserve Bank of Chicago, credit conditions have begun to tighten (blue line), but for some reason the dollar is not feeling it and continues to weaken (red line is the annual trend of the dollar) – suggesting that the dollar market is “long-covered” before rising.

FOREIGN EXCHANGE BALANCES

U.S. financial system currency balances are unchanged for the week (blue line), remain at the levels of the beginning of the year

The red line is a reversal of the dollar, last week's data, but we know that the dollar has remained under pressure this week, which locally does not fit with the dynamics of the volume of currency balances.

The red line is a reversal of the dollar, last week’s data, but we know that the dollar has remained under pressure this week, which locally does not fit with the dynamics of the volume of currency balances.

CONCLUSION

1) The picture with the dollar is interesting: increased demand from non-residents in two of the three considered directions, as well as flat dynamics of currency balances and reduced liquidity, combined with tightening credit conditions – suggesting that the current dollar decline is the final one before the start of growth.

2) The Treasury bill also looks curious, and if tax revenues are lower than expected because of lower corporate earnings, everybody will be talking about a liquidity shortage at one of the guarantors of stability in the U.S. financial system.

3) There is also an expressive divergence accumulated between the S&P500 index and the volume of free liquidity in the system, which can be interpreted as potential pressure on the stock market, especially since the cycle of liquidity withdrawal by the Ministry of Finance is ahead, i.e. the liquidity indicator will start to decline steadily.

4) I continue to believe that a new risk-off wave is coming, which will be heavier relative to the spring 2022 wave, which will end in the summer with a move to control the yield curve or lower rates, I am leaning towards the first instrument. @ESG_Stock_Market

World inflation data. Inflation in the US, what has changed? Inflation in Europe #inflation

World inflation data. Inflation in the US, what has changed? Inflation in Europe #inflation

World inflation data. Inflation in the US, what has changed? Powell’s inflation indicator. Inflation in Europe. I’ll give you a couple of tips

1️⃣ US labor market: still hot. The situation with vacancies remained very aggressive, the number of open vacancies even increased and is 1.9 times higher than the number of unemployed, which is a lot. Weekly applications for unemployment benefits remain below 200 thousand. The salary fund is growing by 7.7% YoY – this is a couple of tenths less than it was a quarter earlier, but still significantly higher than what would meet the Fed’s 2% inflation target. The flow of nominal income remains quite aggressive.

2️⃣ Excess savings remain high, but their “eating through” has accelerated. The volume of deposits and money market funds in households is ~ $3.0 trillion, although it has dropped to 95% of disposable income, but it is much higher than the docklike ~80%. This allows American households to save less and spend more – the savings rate of Americans has increased slightly, but still remains at extremely low levels of 4.4%. Although the banking crisis accelerates the processes in the first quarter, but there is still a long way to normalize here – there is something to spend.

3️⃣ The debt burden is low, but it has become more difficult to borrow. The amount of debt of the population relative to their disposable income of 99% is even slightly lower than in previous quarters. The decrease is due to the slowdown in mortgages (the main part of the debt) against the background of increased rates, the growth of nominal incomes and, of course, the write–off of student loans at the expense of the budget – this played a major role. Americans spent 9.7% of their income on debt servicing, which is very, very little by historical standards. There is still enough stock here, although high mortgage rates limit the possibilities of borrowing, but writing off student debts allows you to borrow several hundred billion extra. Mortgage debt has remained at lows since the 1960s and is 28.8% of the value of real estate in the United States.

4️⃣ Wealth Effect: The value of US household assets remains high. The total asset value of American households remains extremely high at 874% of disposable income. This is still above the docklike levels, but the situation varies for different income groups. The situation in the TOP10 is much better, both due to the increase in the value of financial assets and real estate. At BOTTOM90 – mainly due to the growth in the volume and value of real estate, deposits, pension plans and long-term goods. In general, the situation here is not yet conducive to Americans starting to save.

In general, we can say that the growth potential of Americans’ consumer spending remains high 6-8% YoY, which is much higher than what the Fed would like to see. At the same time, the budget incentive has rather increased, both due to the write-off of loans, and due to various kinds of social payments. In general, all this supports a fairly high potential for maintaining the increased growth rates of nominal expenditures, and as a result, inflation. The first “explosions” in the financial market may somewhat accelerate the processes (tightening of financial conditions), but given that history was immediately flooded with money, the impact will be limited.

​​#USA #inflation #economy #Fed #debt #rates #dollar

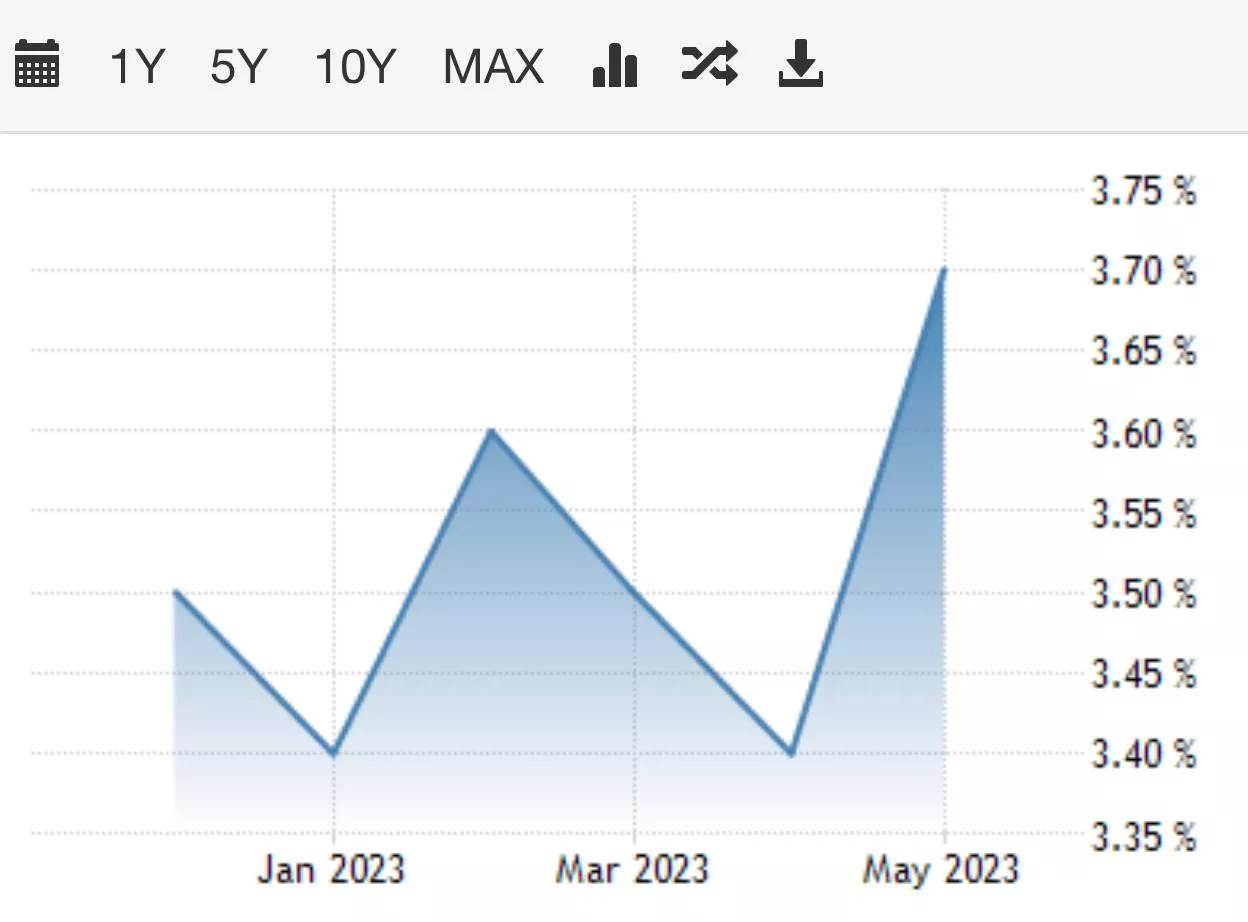
Powell ‘s inflation indicator is stability …

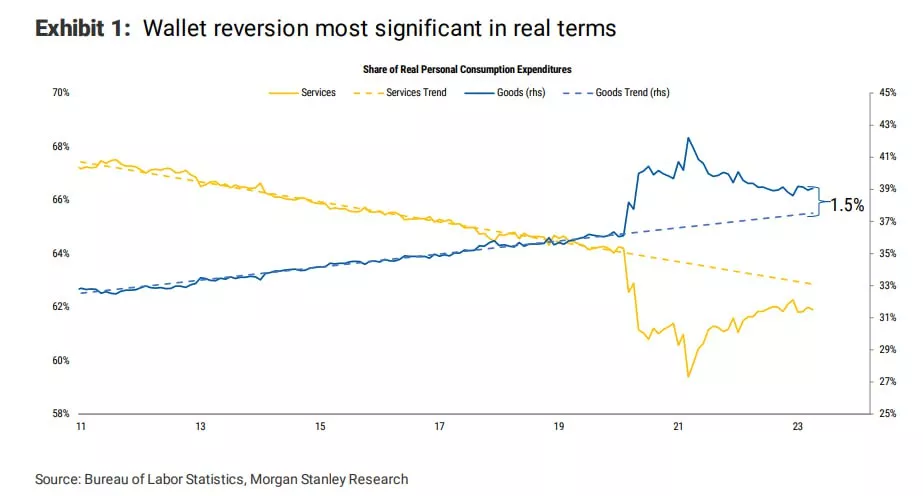
The report on the consumer spending deflator came out slightly better than market expectations, prices rose by 0.3% mom and 5.0% YoY. And even core inflation came out not so bad 0.3% mom and 4.6% YoY – the market was waiting for 4.7% YoY. Commodity inflation against the background of migration of consumption into services is modest and amounted to 0.2% mom and 3.6% YoY. Although the disinflationary effect of prices for used cars continued here (-2.8% mom and -12.3% YoY) – the dynamics is strange, because wholesale prices for them have been rising for several months in a row, and earlier prices were correlated. Prices for short-term goods increased by 0.3% and 5.4% YoY.

The main inflation in services, although not to say that it is huge here, is stable 0.3% mom and 5.7% yoy. Housing is getting more expensive by 0.7% mom and 8.2% yoy, but the Fed is turning a blind eye to it, because there is inertial growth. The most important thing is where J. is looking.Powell and Co. are services inflation excluding housing and energy prices – they added 0.3% mom and 4.7% YoY – stability, in January it was also 4.7% YoY. The increase in these prices for three months amounted to 5.0% in annual terms. In this part of inflation, nothing actually changes, something is accelerating, something is slowing down, but the index has been dead in the range of 4.2-5% annual growth for two years now. With a neutral real rate of about 0.5%, the Fed’s policy is clearly not up to the “restrictive policy” (the real rate is 1-2%)…

​​#eurozone #inflation #ECB #rates #economy #EUR

Euroinflation

Euroinflation

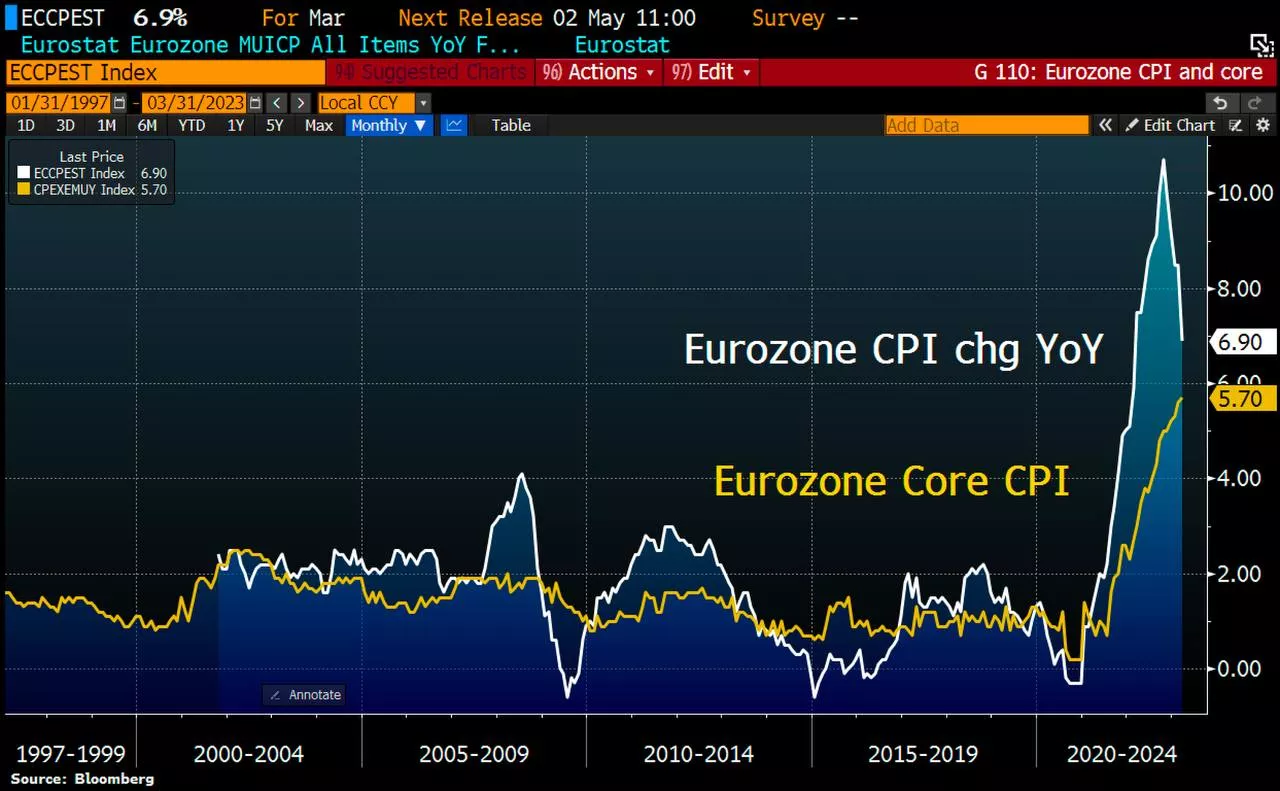
Inflation in the eurozone in March was 0.9% mom, although annual inflation slowed to 6.9% YoY, this slowdown is mainly due to the high base of last year. The only factor slowing price growth was energy (-2.2% mom and -0.9% YoY), everything else was actively getting more expensive.

Food products produced 1.3% mom and 15.4% YoY. Without energy and food, core inflation is 1.2% mom and a record 5.7% YoY. Although the price growth for goods without energy slowed down a bit (6.6% YoY), but the price growth in services accelerated to 5% YoY. The influence of energy has gone, but inflation has remained.

At the same time, unemployment is at historical lows of 6.6%.
With the economy, everything is not particularly positive – real retail sales in Germany fell by 1.3% mom and collapsed by 7.1% YoY, although nominal sales increased by 2.6% yoy. Real sales were 1.6% lower than three years ago.

Consumption of goods in France fell by 0.8% mom and 4.1% YoY in real terms. First of all, this applies to food (-1.5% mom and -9% yoy). Consumption in France is at the levels of a decade ago, but this is in real terms. Protests against the background of pushing pension reform will add additional negativity to the French economy.

Low unemployment and labor shortage are side by side with a drop in living standards against the background of high inflation – such an entertaining reality. So the real strikes are still ahead here.

​​#Germany #inflation #Eurozone #economy #rates #Crisis

Inflation in Germany is not retreating

Inflation in Germany is not retreating

The growth of consumer prices in March, according to preliminary data, amounted to 0.8% mom and 7.4% yoy. Although annual inflation has slowed down, this is only the effect of the base of last year, when prices jumped by 2.4% mom in a month.

According to the Eurostat methodology, consumer prices in Germany are growing by 1.1% mom and 7.8% YoY. The growth of energy prices has slowed down sharply (+3.5% YoY compared to 19.1% yoy in February) – there are a lot of subsidies. But the growth of food prices accelerated even more (+22.3% YoY versus +21.8% in March). The growth of prices in services accelerated to 4.8% YoY, even though rents in Germany continue to rise by a modest 2% (but much is administratively regulated here).

In Spain, it is also interesting, inflation was 0.4% mom and due to the effect of the base collapsed to 3.3% yoy. But core inflation in Spain was 0.7% mom and 7.5% YoY.

So the ECB, as some Eurobankers say, “still has a lot of work to do”, it is unlikely that monthly prints of 0.7-1% mom correspond to the ECB’s goal. The reaction of the markets rather indicates that they continue to believe in the story that rates will rise and everything will be fine… and there will definitely be no SVB in Europe … well , we ‘ll wait )

#germany #sentiment #recession #crisis #economy

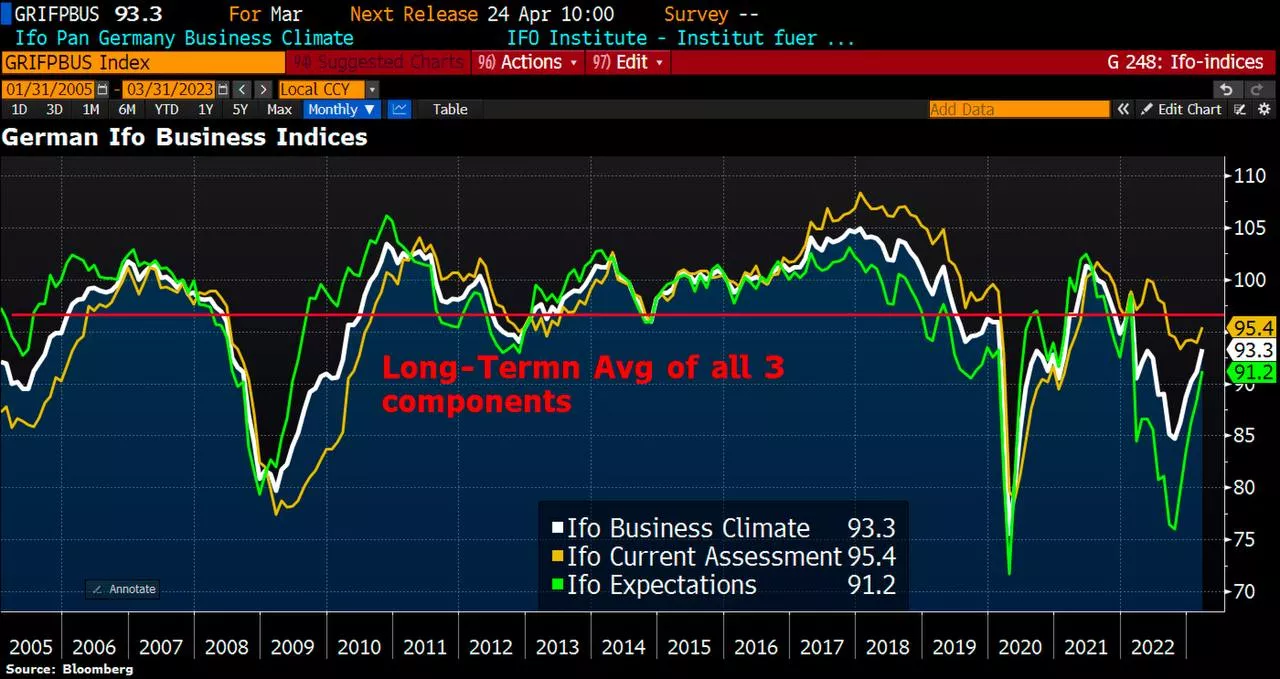
Despite the depressive information background associated with the ECB rate hike, high inflation, the likelihood of a recession and problems in the banking sector, a positive mood prevails in German business circles in March. However, it is worth remembering that the more expectations are inflated, the deeper the disappointments will be

#recession #europe #ecb #rates #economy

recession in Europe has reached 100%

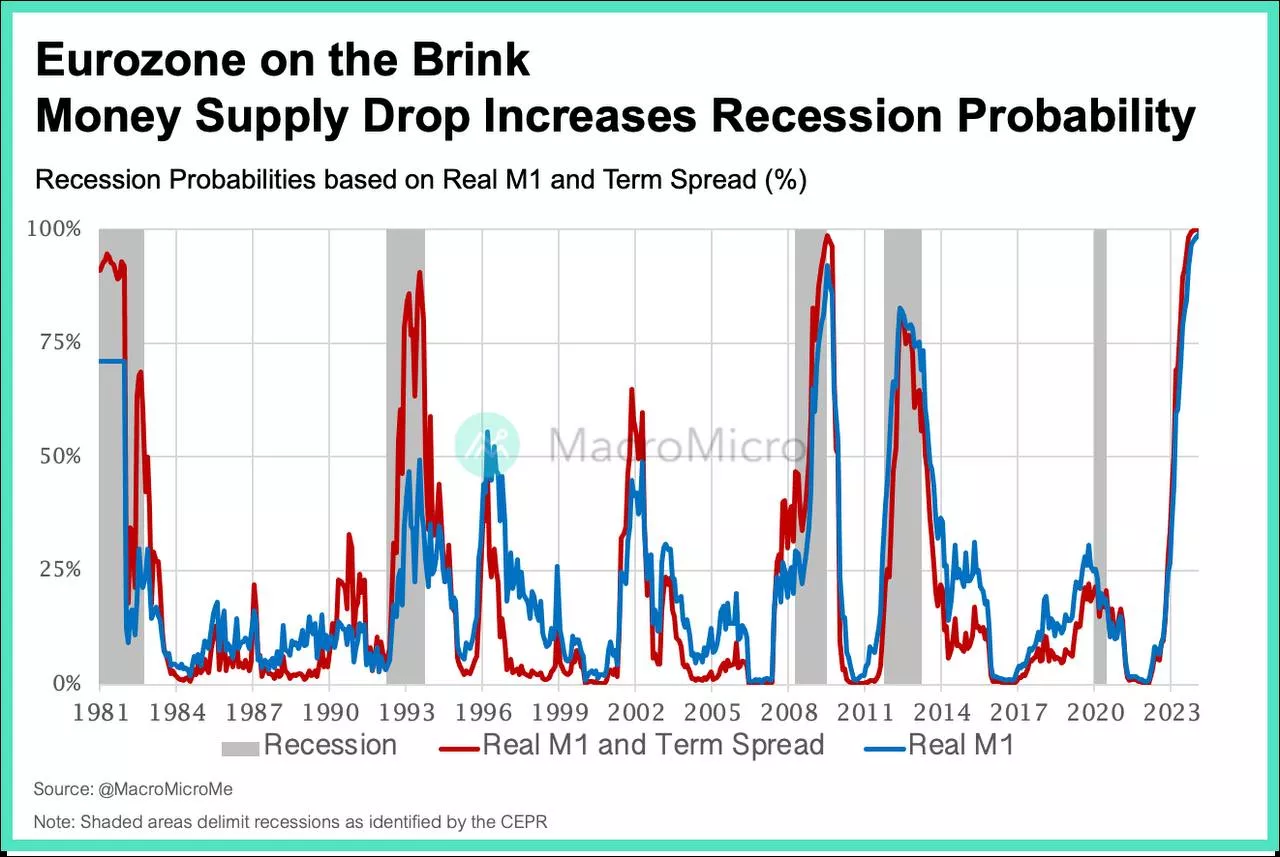
The MacroMicroMe team used the ECB 2019 model to estimate the likelihood of a recession in the EU. This model is based on the real money supply and the state of the yield curve. The results showed that the probability of a recession in Europe has reached 100%, which is an exceptional event over the past 40 years.

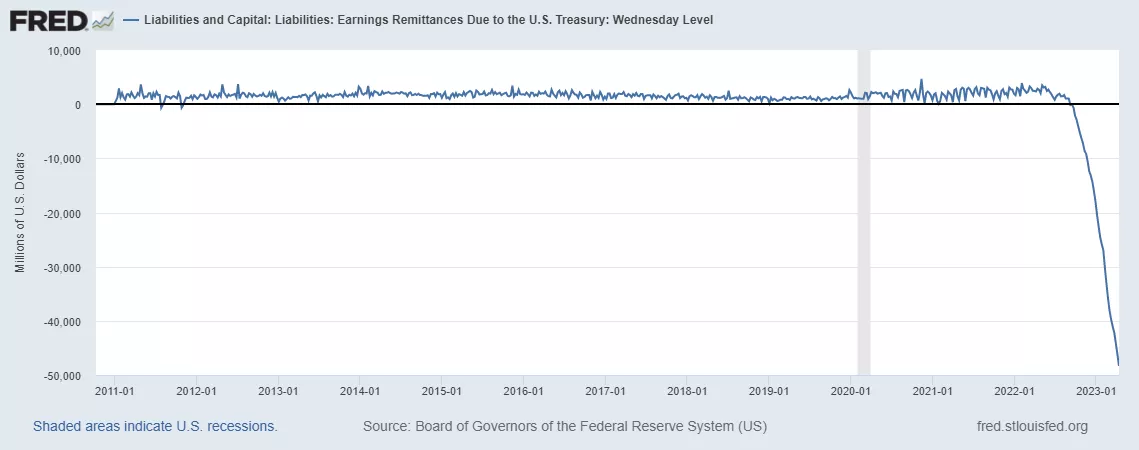
And remember: #Fed #rates #qt #prep #finance #economics

The Fed is in the toughest monetary policy tightening cycle since 1983

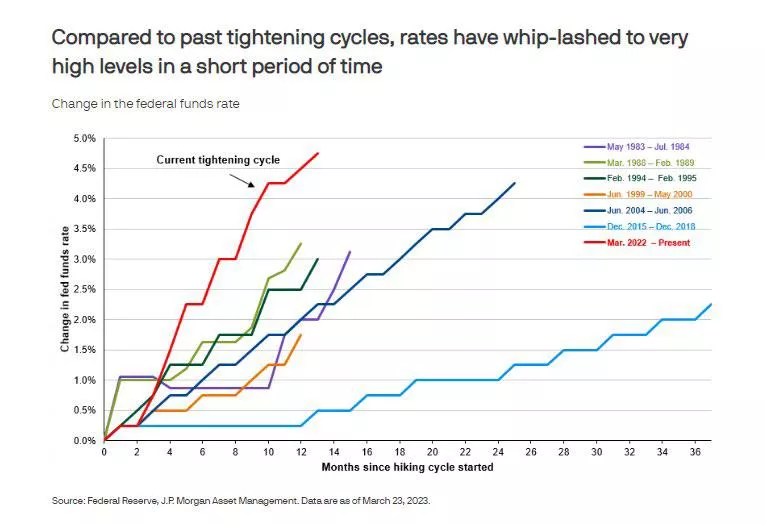
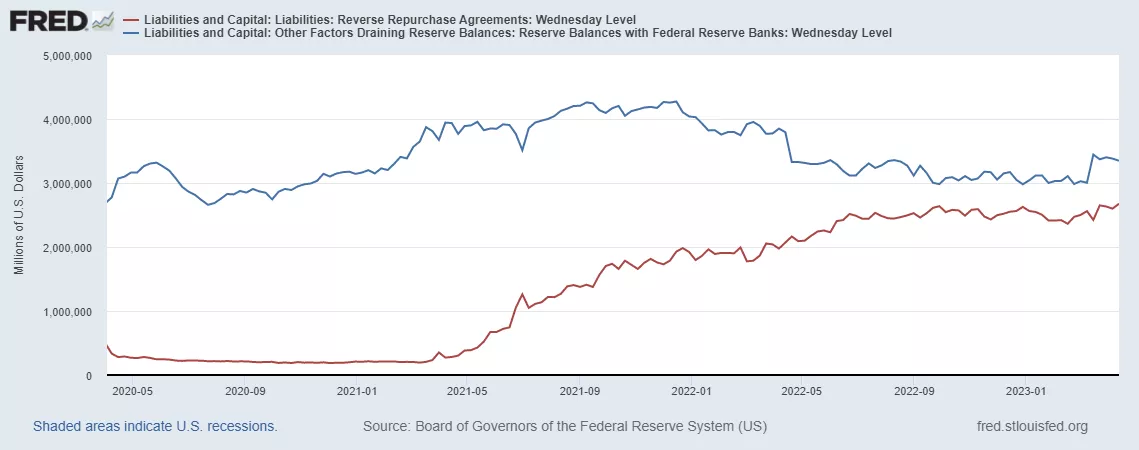
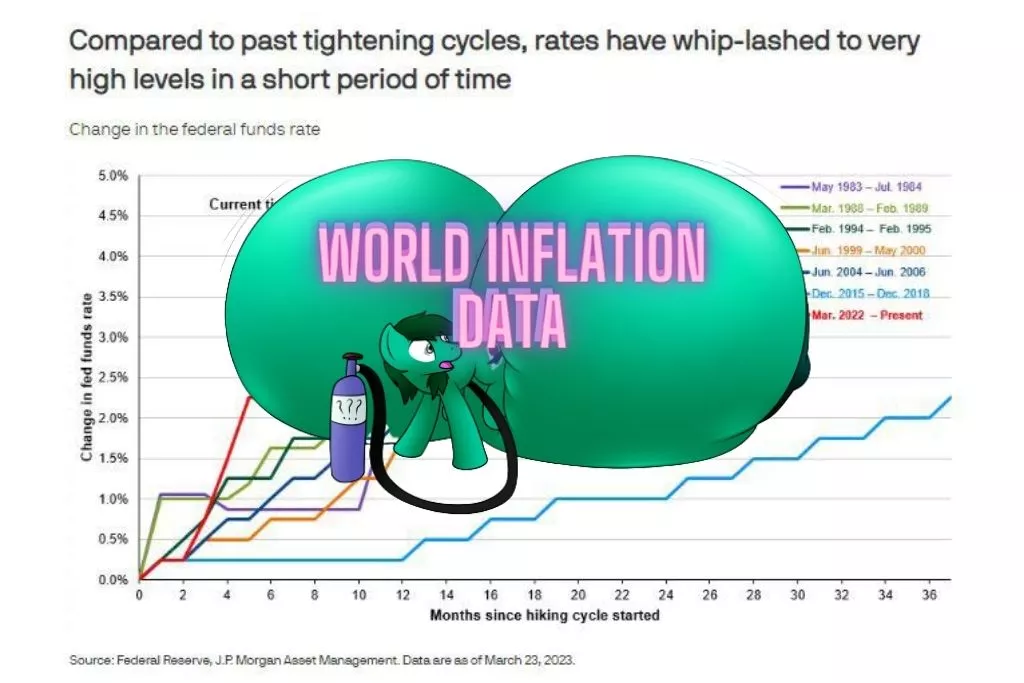
The Fed is in the toughest monetary policy tightening cycle since 1983: rates are rising faster and have reached historically high values, which is reflected in the red line on the chart.
However, the worst thing is that the financial system is already under stress, and inflationary pressure in the US economy remains stable. The monthly increase in core inflation corresponds to the average rate of the 80s of the last century, which indicates that even such a strict policy of the Fed is not able to effectively combat inflation. Moreover, business activity revived in March, which is a signal of sustained inflation. @ESG_Stock_Market

Don`t copy text!